
Multi-World Analysis
Bitcoin, balance, and the law of support and resistance

Previously on Murim trading…
Now back to the present…
“Greetings pupils. I hope you all had a wonderful holiday. Hopefully your liquor and herbs were as strong as mine. But that’s over now. Back to work. We will jump directly into the charts.
-Professor.”
Enough pleasantries. We are going to the library. Follow quickly.
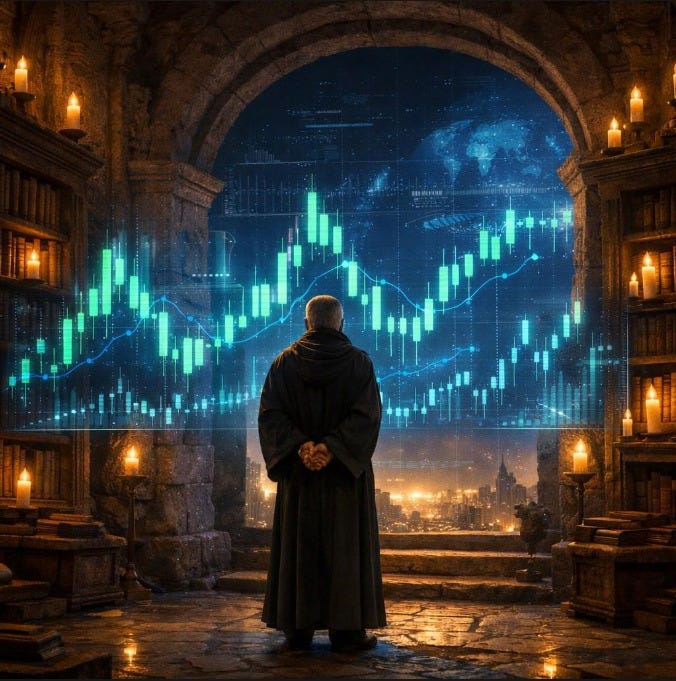
Let’s start off swinging. Our destination is the land of Bitcoin. If you move your gaze to the chart below, you’ll notice a range. This is a range on the daily timeframe, so we treat the support and resistance as major factors. Due to the scale, these levels are highly respected. You can see that price has interacted with them on both sides and still continued to respect them.
Now check out the blue circle on the right. That was a high volume first touch on the FVG. Coincidentally, that was when America’s president increased tariffs. Take note, this FVG was formed back in 2024.
As I said, it was a first touch, which means the market will return to fill that FVG. The only real question is when.
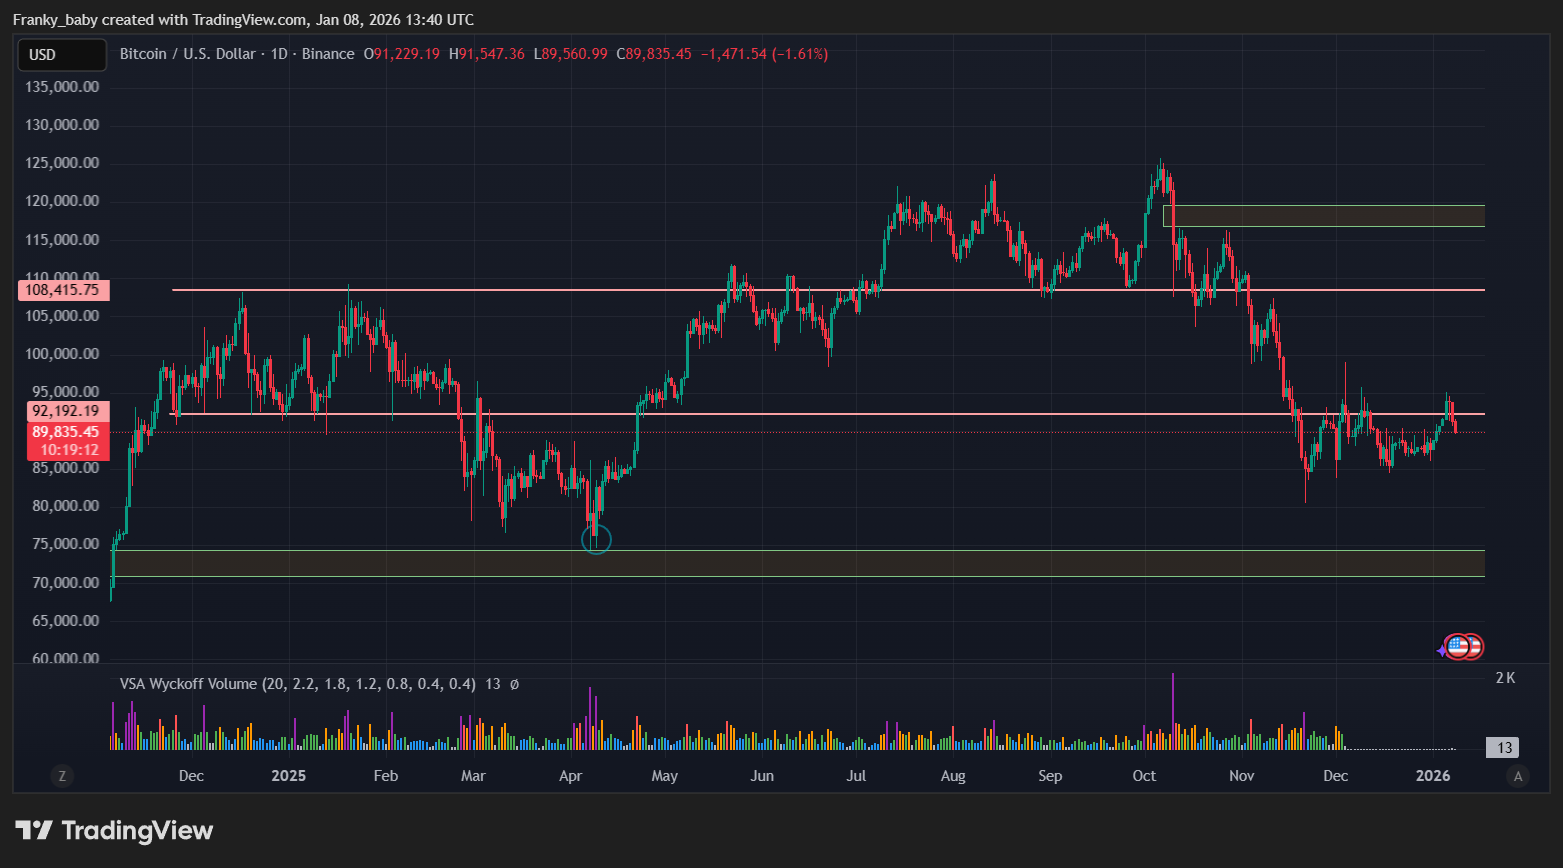
Let’s dive deeper and look at more current affairs, and I don’t just mean your mistress. This is the same chart but closer to home. We’ll do a top to bottom breakdown.
Starting with the circle at the top, that was a sweep. The market never went that high again. Instead, it started creating lower highs. These highs remain untouched, which means liquidity is being farmed.
On the bottom, notice the lines I drew. They show constant higher lows. That side is also being farmed. So which side is better, you ask? Let me explain.
Factor one, we are in a downtrend.
Factor two, there was an upside fakeout.
Factor three, liquidity was built on the downside.
And the final nail in the coffin, price hit that highly respected support level with basically nonexistent volume.
That tells us it’s highly unlikely price will push through.
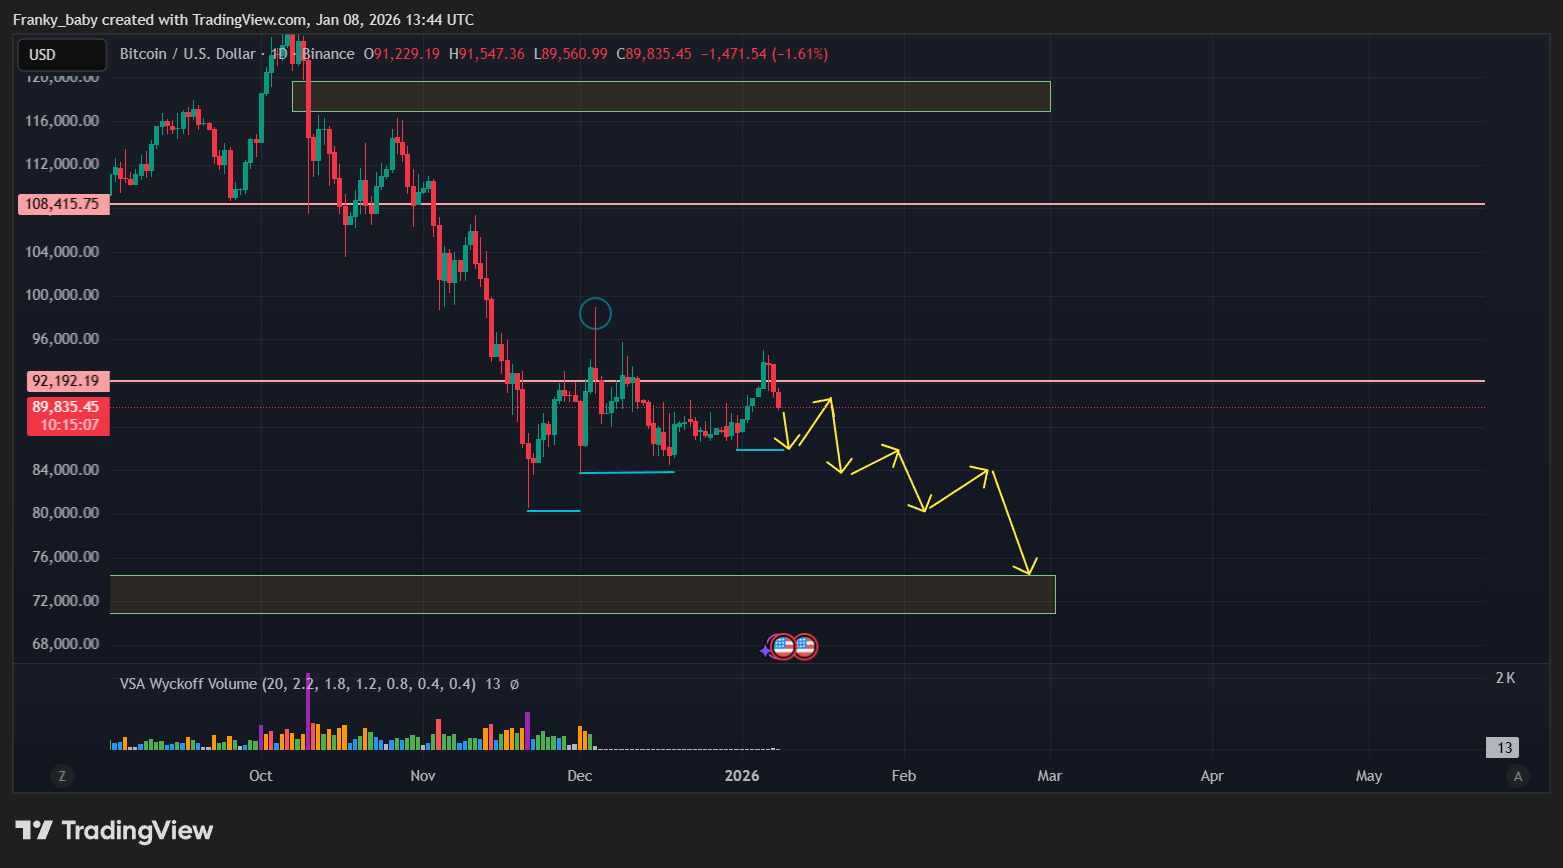
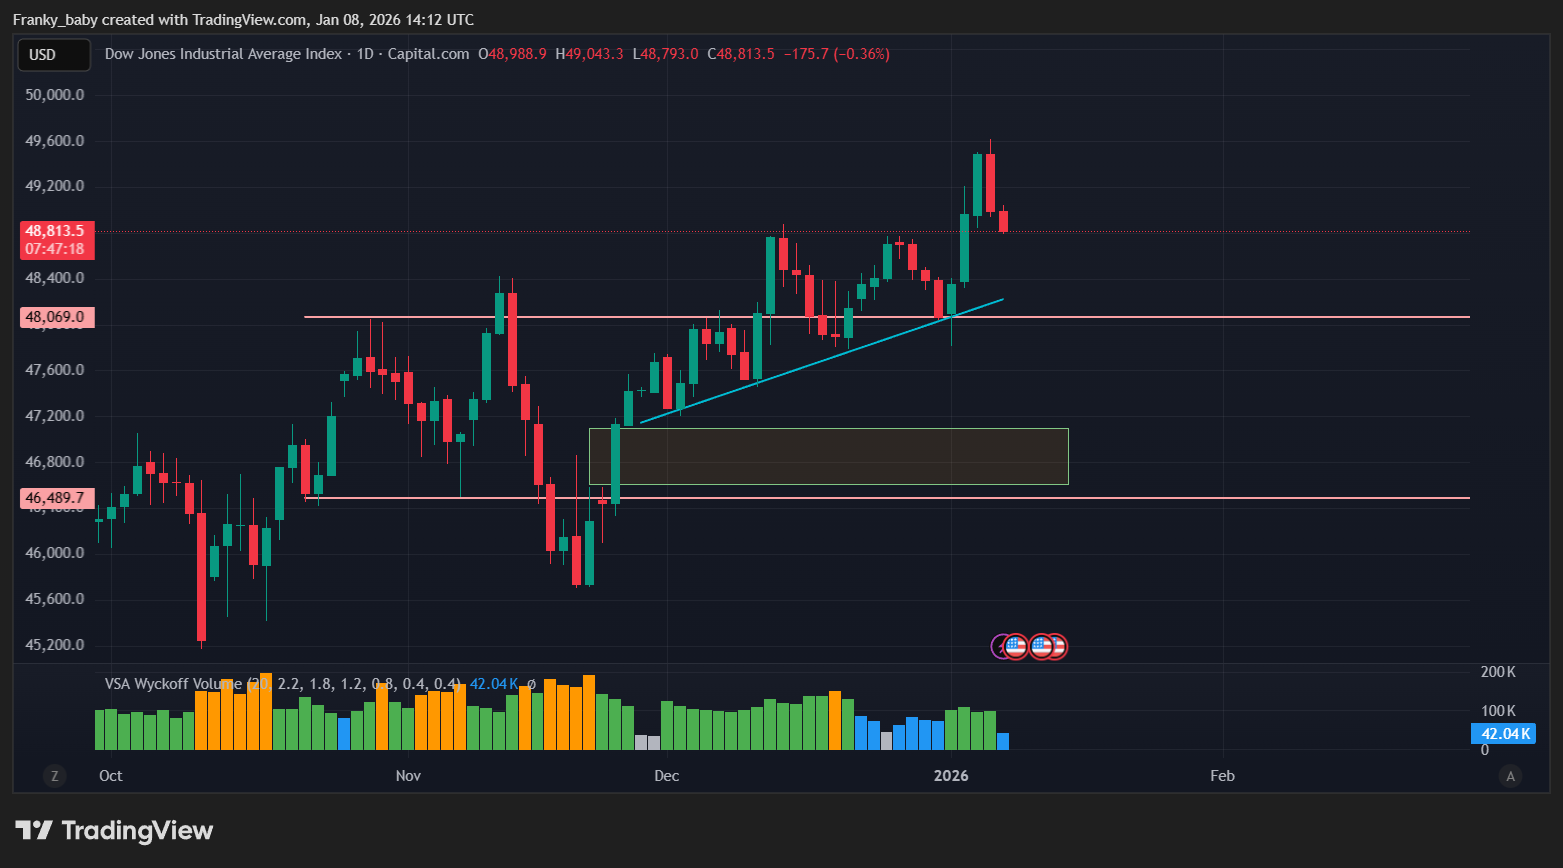
Now let’s flip the board and see what the other side is doing. Below is the US30 daily chart. I’m here because of the inverse relationship between the dollar and Bitcoin.
We’ll start with the basics. Support. Resistance. Volume. FVG. From this angle it looks simple, almost like price will just fall. But I want you to learn the details.
So let’s go into the 4 hour chart. There is no such thing as a simple market move. What you’re seeing here is price bouncing off the larger FVG in order to complete the smaller one above it. This will correlate with that last higher low on Bitcoin. When this moves up, the inverse will happen on BTC.
We know this bounce is happening because of the first touch rule. You might ask why it doesn’t just fill the higher FVG immediately. That’s because we are still in a mini uptrend. The market will always target the nearest FVG relative to its current direction before changing course and consuming liquidity.
Notice how this movement forms what others call a head and shoulders pattern. That’s fine. Patterns are nice. But understand this, all of it still obeys the law of support and resistance. Price was always bound to return to that level, either to bounce or to break.
That simple law contains multiple worlds within it. When you trade, no matter the method, always use the multi world theory. There are no wrong methods. Only interpretations.


Enough training for today. Let’s go to the garden and I’ll show you some of these herbs I’ve been talking about.

Interesting framing. Markets aren’t one world with one answer, they’re a set of overlapping possibilities. How do you choose which world matters most in real time?